NOAA Rainfall Intensity Data Reveals Drastic Shift in Texas Climate Benchmarks and Flood Vulnerability
New federal data shows South Texas rainfall benchmarks surged up to 40% compared to historical standards, impacting state infrastructure and urban planning
Editorial disclaimer: Opinions and analysis on Keep TX Red are editorial content — not statements of fact. See our editorial standards.
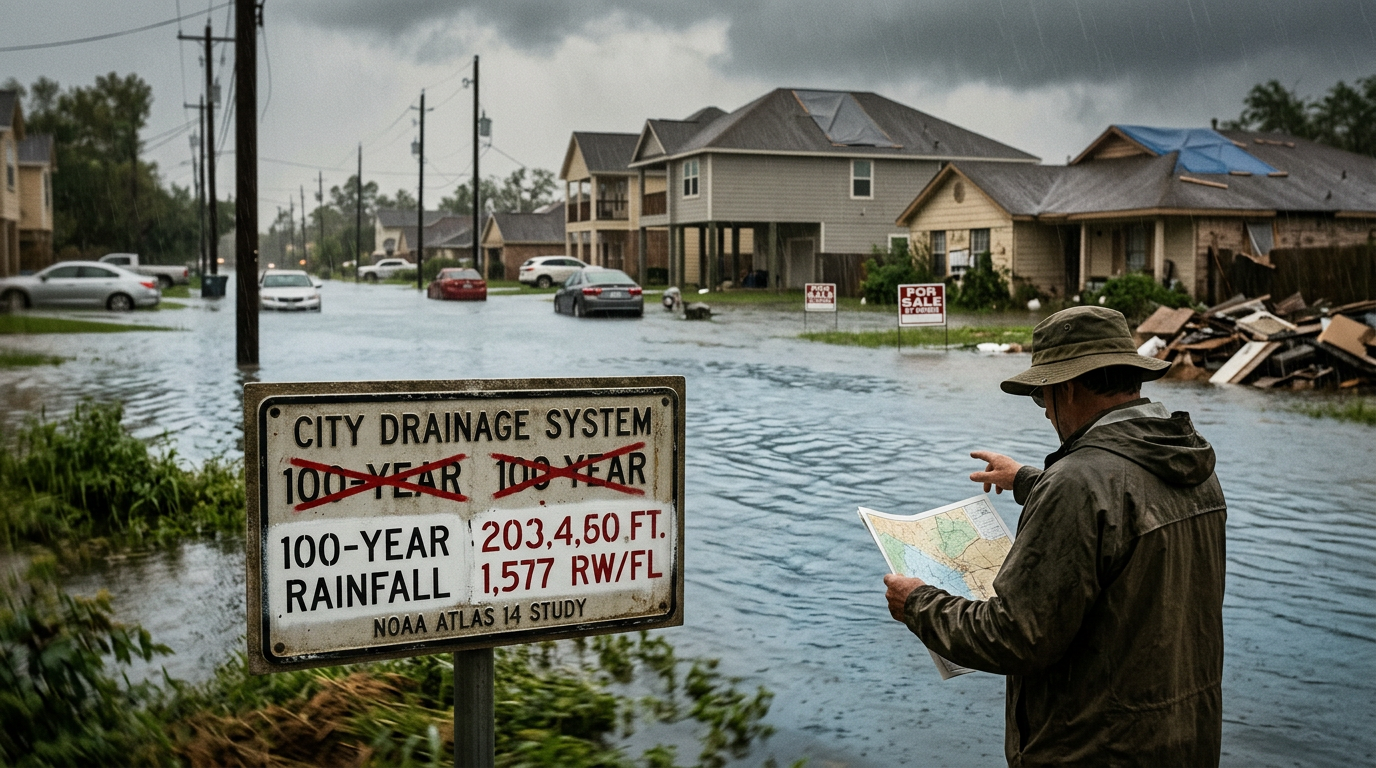
Recent data evaluations from the National Oceanic and Atmospheric Administration (NOAA) have unveiled a dramatic shift in how Texas must prepare for extreme weather events. The update, primarily encapsulated in the Atlas 14 study, replaces outdated rainfall frequency metrics that had been the industry standard since the early 1960s. Historically, engineers and city planners throughout the state relied on the U.S. Weather Bureau’s 1961 Rainfall Frequency Atlas of the United States to define what constituted a 100-year storm. This legacy data was used to design bridge clearances, drainage systems, and residential sewage capacities that millions of Texans rely on today. However, the current findings reveal that the volume of water falling during peak events has increased so significantly that the old benchmarks are no longer viable for public safety. In various sectors of South Texas, particularly the regions situated west of San Antonio, the intensity of these benchmark rainfall events has seen a rise of between 30 and 40 percent. This statistical leap suggests that what was once considered a rare, century-level flood event may now occur with much greater frequency. The magnitude of this uptick in South Texas is noted as being among the most extreme in the entire state, raising urgent questions among scientists and risk management experts regarding the underlying systematic changes in the region's atmospheric patterns. As the state continues to experience rapid population growth, the gap between old engineering standards and new meteorological realities presents a significant hurdle for local municipalities seeking to protect life and property.
Texas relevance
For the state of Texas, these findings are not merely academic; they represent a fundamental shift in the legal and physical landscape of urban development. Specifically, cities like San Antonio and the surrounding Hill Country counties are now forced to reconcile modern construction with data that shows these areas are increasingly susceptible to flash flooding. Throughout the history of the Lone Star State, the 'Flash Flood Alley' corridor has been a point of concern for the Texas Water Development Board and local authorities. This new federal data validates the concerns of residents in South and Central Texas who have witnessed more frequent disruptions to transportation and commerce due to rising waters. The economic relevance is immense, as adjusting to these new rainfall estimates could require billions of dollars in infrastructure upgrades to prevent catastrophic failures during future storms.
The Obsolescence of the 1961 Atlas
For over half a century, the 1961 Rainfall Frequency Atlas served as the foundational document for almost all civil engineering projects in Texas. This document defined the parameters for managing stormwater and set the thresholds for what developers needed to build to ensure safety. At the time of its publication, the data was considered comprehensive, reflecting the known weather patterns of the mid-20th century. However, as the decades passed, the gap between the 1961 projections and the actual rainfall observed on the ground began to widen, leaving many Texas communities under-prepared for the storms that were actually occurring.
The shift to the Atlas 14 dataset marks the first time in nearly sixty years that federal authorities have fully integrated modern meteorological observations into the official record for Texas. The previous reliance on sixty-year-old data meant that bridges, culverts, and dams were often being built to withstand storms that were significantly smaller than what current weather patterns produce. This discrepancy has been a primary driver in recent urban flooding incidents where infrastructure designed to 'spec' failed because the 'spec' itself was fundamentally outdated.
South Texas as a High-Intensity Hotspot
The most striking revelation of the NOAA data is the disproportionate impact on South Texas. While rainfall intensity has increased across much of the state, the region west of San Antonio stands out as a focal point for extreme change. Experts from risk management firms, such as Simfero in Houston, have noted that the 30 to 40 percent increase in this specific area is a statistical outlier compared to the rest of the country. This suggests that the Edwards Plateau and the South Texas Plains are facing a unique set of meteorological pressures that defy traditional historical modeling.
Local officials in these areas are now grappling with the reality that their existing flood control maps may be dangerously inaccurate. A 30 percent increase in intensity doesn't just mean more rain; it means that the volume of water hitting the soil in a short period overwhelms the land's natural ability to absorb it. For the agricultural and ranching communities in these zones, this shift affects everything from soil erosion to the structural integrity of rural low-water crossings, which are a staple of the South Texas landscape.
Economic Implications for Texas Housing
The reassessment of rainfall data has immediate consequences for the Texas real estate market and the insurance industry. As the 100-year floodplain expands based on the new NOAA data, thousands of homes that were previously considered 'safe' may now be reclassified as high-risk. This shift often mandates that homeowners purchase flood insurance, adding an unforeseen cost to property ownership. In a state that prides itself on affordable living and a robust housing market, these environmental adjustments necessitate a careful balance between safety and economic viability.
Furthermore, new residential developments must now account for these higher intensity levels during the planning phase. For a developer in the San Antonio suburbs, this means bigger retention ponds, wider drainage ditches, and more sophisticated overflow systems. While these requirements increase the initial cost of construction, they serve as a necessary investment to prevent the massive property loss claims that have plagued the state following major tropical and convective storm systems in recent years.
Infrastructure Challenges at the Municipal Level
Texas cities are currently facing an 'infrastructure gap' created by the updated federal data. Many municipal drainage systems were scaled for the 1961 intensity levels, meaning they are now effectively undersized for the modern climate. Retrying and replacing this subsurface infrastructure is an enormous task that involves digging up city streets and rerouting essential services. For major metros, the cost of these upgrades can reach into the hundreds of millions of dollars, requiring clever financing through municipal bonds or state grants.
In addition to physical pipes and tunnels, cities are also revising their local ordinances to reflect the Atlas 14 data. By codifying these higher standards into city law, local governments can ensure that all future growth is resilient. This creates a more stable environment for businesses looking to relocate to Texas, as it provides a guarantee that the local government is taking proactive steps to mitigate climate-related business disruptions.
The Scientific Search for Systematic Causes
Scientists like Matthew Berg are increasingly looking at whether these shifts in rainfall are part of a larger systematic change in the Gulf of Mexico's moisture transport systems. The consistency with which these intensity spikes are appearing suggests that they are not merely anomalies. Researchers are investigating how warmer air temperatures over the Texas landmass are interacting with high moisture levels from the coast, creating an environment where storms can 'stall' and dump larger quantities of water in concentrated areas.
Understanding these patterns is vital for the long-term sustainability of the state. If the trend of increasing intensity continues, the benchmarks set in 2018 may eventually need to be revised again. This highlights the need for continuous monitoring and a flexible approach to state engineering. The goal for Texas scientists is to move toward predictive modeling that doesn't just look at what happened in the past, but anticipates the intensified moisture cycles of the future.
Impact on Central and Coastal Texas Regions
While South Texas saw some of the most dramatic increases, the impact of the updated NOAA data is felt statewide. From the Piney Woods of East Texas to the coastal prairies, the Atlas 14 data generally shows an upward trend in peak rainfall. For the Houston area, which has already been battered by series of '500-year' events in the last decade, the new data provides a formal explanation for why recent storms have felt so much more destructive than those of the 20th century.
Coastal regions must deal with the dual threat of increased rainfall intensity coupled with storm surges. The updated federal data provides these communities with a better roadmap for building sea walls and levee systems that can handle both the water coming from the sky and the water coming from the ocean. This holistic view of water management is essential for protecting the Texas energy corridor and the various ports that drive the state's international trade.
The Role of the Texas Water Development Board
The Texas Water Development Board (TWDB) has become a central player in disseminating this data and providing the funding necessary for local communities to adapt. Through the state's flood planning process, which was significantly expanded by the Texas Legislature in 2019, the TWDB uses the Atlas 14 numbers to allocate resources to the areas of greatest need. This state-led effort ensures that smaller, rural counties aren't ignored in favor of the larger urban centers.
By providing a centralized clearinghouse for rainfall data and flood mapping, the state of Texas is leading the nation in proactive flood management. The integration of federal NOAA data into state-level planning tools allows for a synchronized response to the challenges of rising rainfall intensity. This collaboration between federal data providers and state implementers is the key to ensuring that Texas remains a safe and prosperous place to live for the next sixty years.
Analysis
The transition from the 1961 benchmarks to the 2018 Atlas 14 standards represents a critical pivot point for Texas governance. While some may view these adjustments as bureaucratic red tape, the fiscal reality is that sticking to 1960s data in a 2020s environment creates a liability for the state. By acknowledging that rainfall intensity has surged by nearly 50% in some South Texas locales, the state can better prioritize its Flood Infrastructure Fund. This data allows for a more targeted application of taxpayer dollars, ensuring that the most vulnerable corridors near San Antonio and the Rio Grande Valley receive the engineering attention they require. Furthermore, this update provides a shield for property owners by forcing more accurate disclosures of flood risks, which ultimately preserves the long-term value of Texas real estate.
Source attribution
This story was reported using a public release from the r/texas. Keep TX Red rewrote the coverage independently and links to the official statement for verification.
Frequently Asked Questions
- What is Atlas 14?
- Atlas 14 is a peer-reviewed publication by NOAA that provides updated precipitation frequency estimates for the United States. It replaces older datasets with modern statistics, helping engineers and planners understand how much rain is likely to fall during extreme weather events in specific locations.
- How does this affect my property's flood risk?
- Because the new data shows that storms are becoming more intense, areas that were previously thought to be outside of the 100-year floodplain may now be included in it. This could change your flood insurance requirements and the regulations for building or renovating on your property.
- Why was the 1961 data used for so long?
- The 1961 Rainfall Frequency Atlas was the most comprehensive study of its time. Updating these massive datasets requires decades of additional observations, significant federal funding, and complex statistical analysis, which is why the 2018 update was such a major milestone.
- Is the increase in rainfall the same across all of Texas?
- No. While most of the state saw some increase, the intensity of the change varies by region. South Texas and parts of the coast saw the largest jumps, while other parts of North and West Texas saw more moderate increases.
- Who uses this information to build roads and bridges?
- Civil engineers, the Texas Department of Transportation (TxDOT), city planning departments, and private developers all use this data to determine the size of pipes, the height of bridges, and the capacity of drainage systems.
Official Sources
Take the next step
Browse the Newsroom →Read more about Keep Texas Red → Our full guide to what Keep Texas Red means and why Texans support it.
Related Articles


Get Texas updates delivered weekly.
Independent Texas reporting on politics, policy, and daily life. One email a week. Unsubscribe anytime.
Keep TX Red Newsroom
The Keep Texas Red Editorial Staff produces nonpartisan explainers, policy breakdowns, and educational resources to help Texans understand how their government works. All content is reviewed for accuracy and updated regularly.
About Keep TX Red →